Energy consumption for cement production
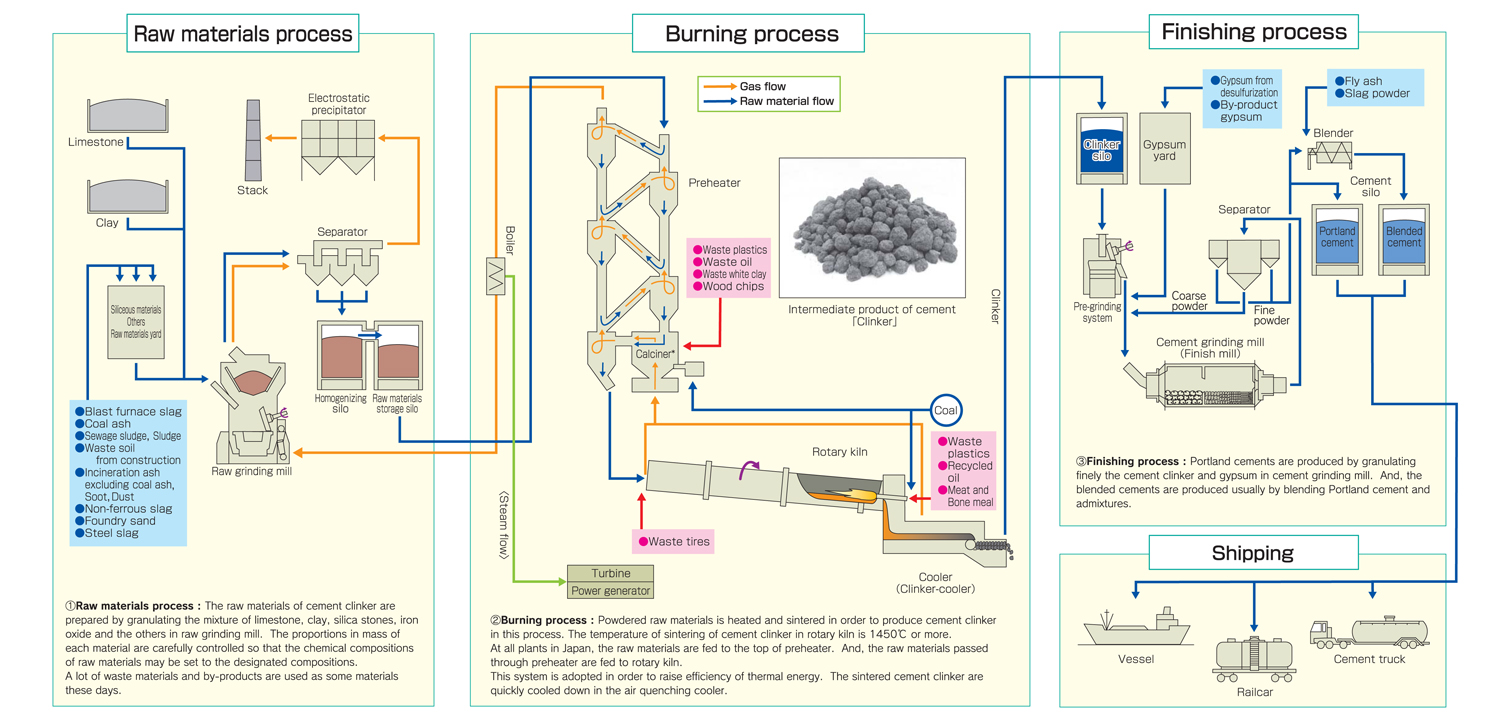
As figure 1 shows, the thermal energy in exhaust gas from kilns and coolers is put to various uses including pre-calcination, drying of raw materials and power generation.
Figure 1 : Schematic diagram of the cement production process
Transition of specific thermal energy consumption for cement production
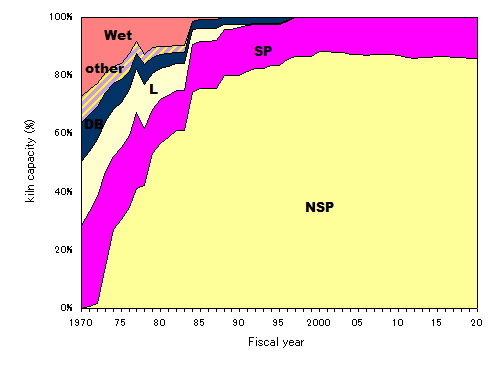
The specific thermal energy consumption for cement production in Japan fell drastically in the 1970s and 1980s (see figure 2), as older kiln systems were replaced by the suspension preheater kiln (SP kiln) or suspension preheater kiln with a precalciner (NSP kiln) (see figure 3). SP kiln and NSP kiln were far more energy-efficient and enabled mass production.
The replacement to SP kiln or NSP kiln was completed by FY 1997 in Japan.
In Figure 2, two specific thermal energy consumption for cement production are showed from FY 1980. The red line is “Net energy consumption”, and it is not include the thermal energy by biomass and alternative fuels. This “Net energy consumption” is used for the performance indicator of the energy consumption in “Commitment to a Low-Carbon Society” (see “Commitment to a Low-Carbon Society”).
On the other hand, the blue line is “Gross energy consumption”.
Note : The biomass and alternative fuels were used hardly between FY 1970 and FY 1979.
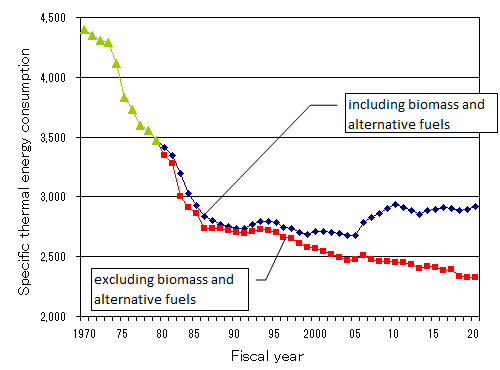 Figure 2 Specific thermal energy consumption for cement production
Figure 3 Kiln capacity by the kiln type
| NSP | : Suspension preheater kiln with a precalciner |
| SP | : Suspension preheater kiln |
| L | : Lepol kiln |
| DB | : Dry process of short kiln with boiler |
| other dry : other dry process |
| Wet | : Wet process |
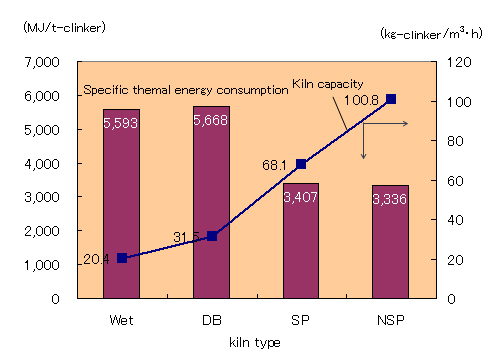
Figure 4 shows the specific thermal energy consumption for clinker production and the kiln capacity(kg-clinker/m3・h).
Thermal energy for clinker produced by SP kilns or NSP kilns was cut down by about 40 percent compared with the wet process and the old type of dry process of short kiln with boiler (DB), yet the kiln capacity of SP kilns could be increased about 3.3 times compared with the wet process. And the kiln capacity of NSP kilns could be increased about 4.9 times compared with the wet process.
Figure 4 Thermal energy efficiency and kiln capacity by kiln types
Effective utilization of thermal energy
Figure 5 shows the typical thermal balance at cement plants in Japan.
Some 80% of the inputted thermal energy is used for clinker burning, drying raw materials, drying coal and power generation.
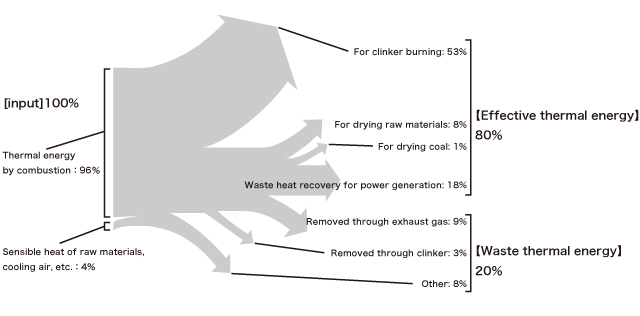
Figure 5 Effective use of thermal energy at cement plant
Transition of specific electric energy consumption
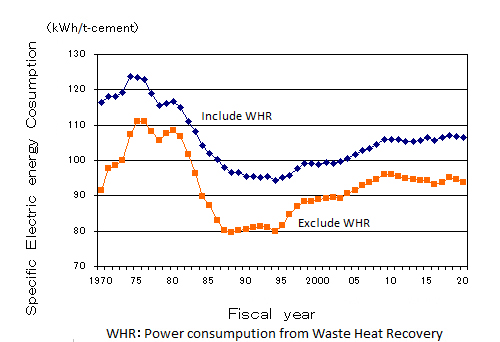
Figure 6 shows the transition of the specific electric energy consumption. The specific electric energy consumption declined in the 1970s and 1980s, as a result of widespread adoption of vertical roller mills at raw material process and pre-grinders at the finishing process. These technologies offer excellent grinding efficiency.
In recent years, however, the specific electric energy consumption has increased, because the electric energy consumption for pre-processing of waste has increased owing to an increase in specific amount of waste for cement production.
Electric power by on-site power generation including power generated by waste heat recovery (WHR) covers more than 60% of total electric energy consumption in Japan.
Electric power generated by WHR in Japan is accounted for about 10% of total electric energy consumption.
Figure 6 Specific electric energy consumption
|